Skip to main content Skip to footer

Watershed Health Monitoring

Otonabee Conservation uses a science-based approach to understand the health of our watershed. We collect water quality and quantity data at locations across the watershed. We also collect information related to climate, including precipitation and water levels. Watershed Report Cards are published every five years to share this information with the community.

Monitoring Programs

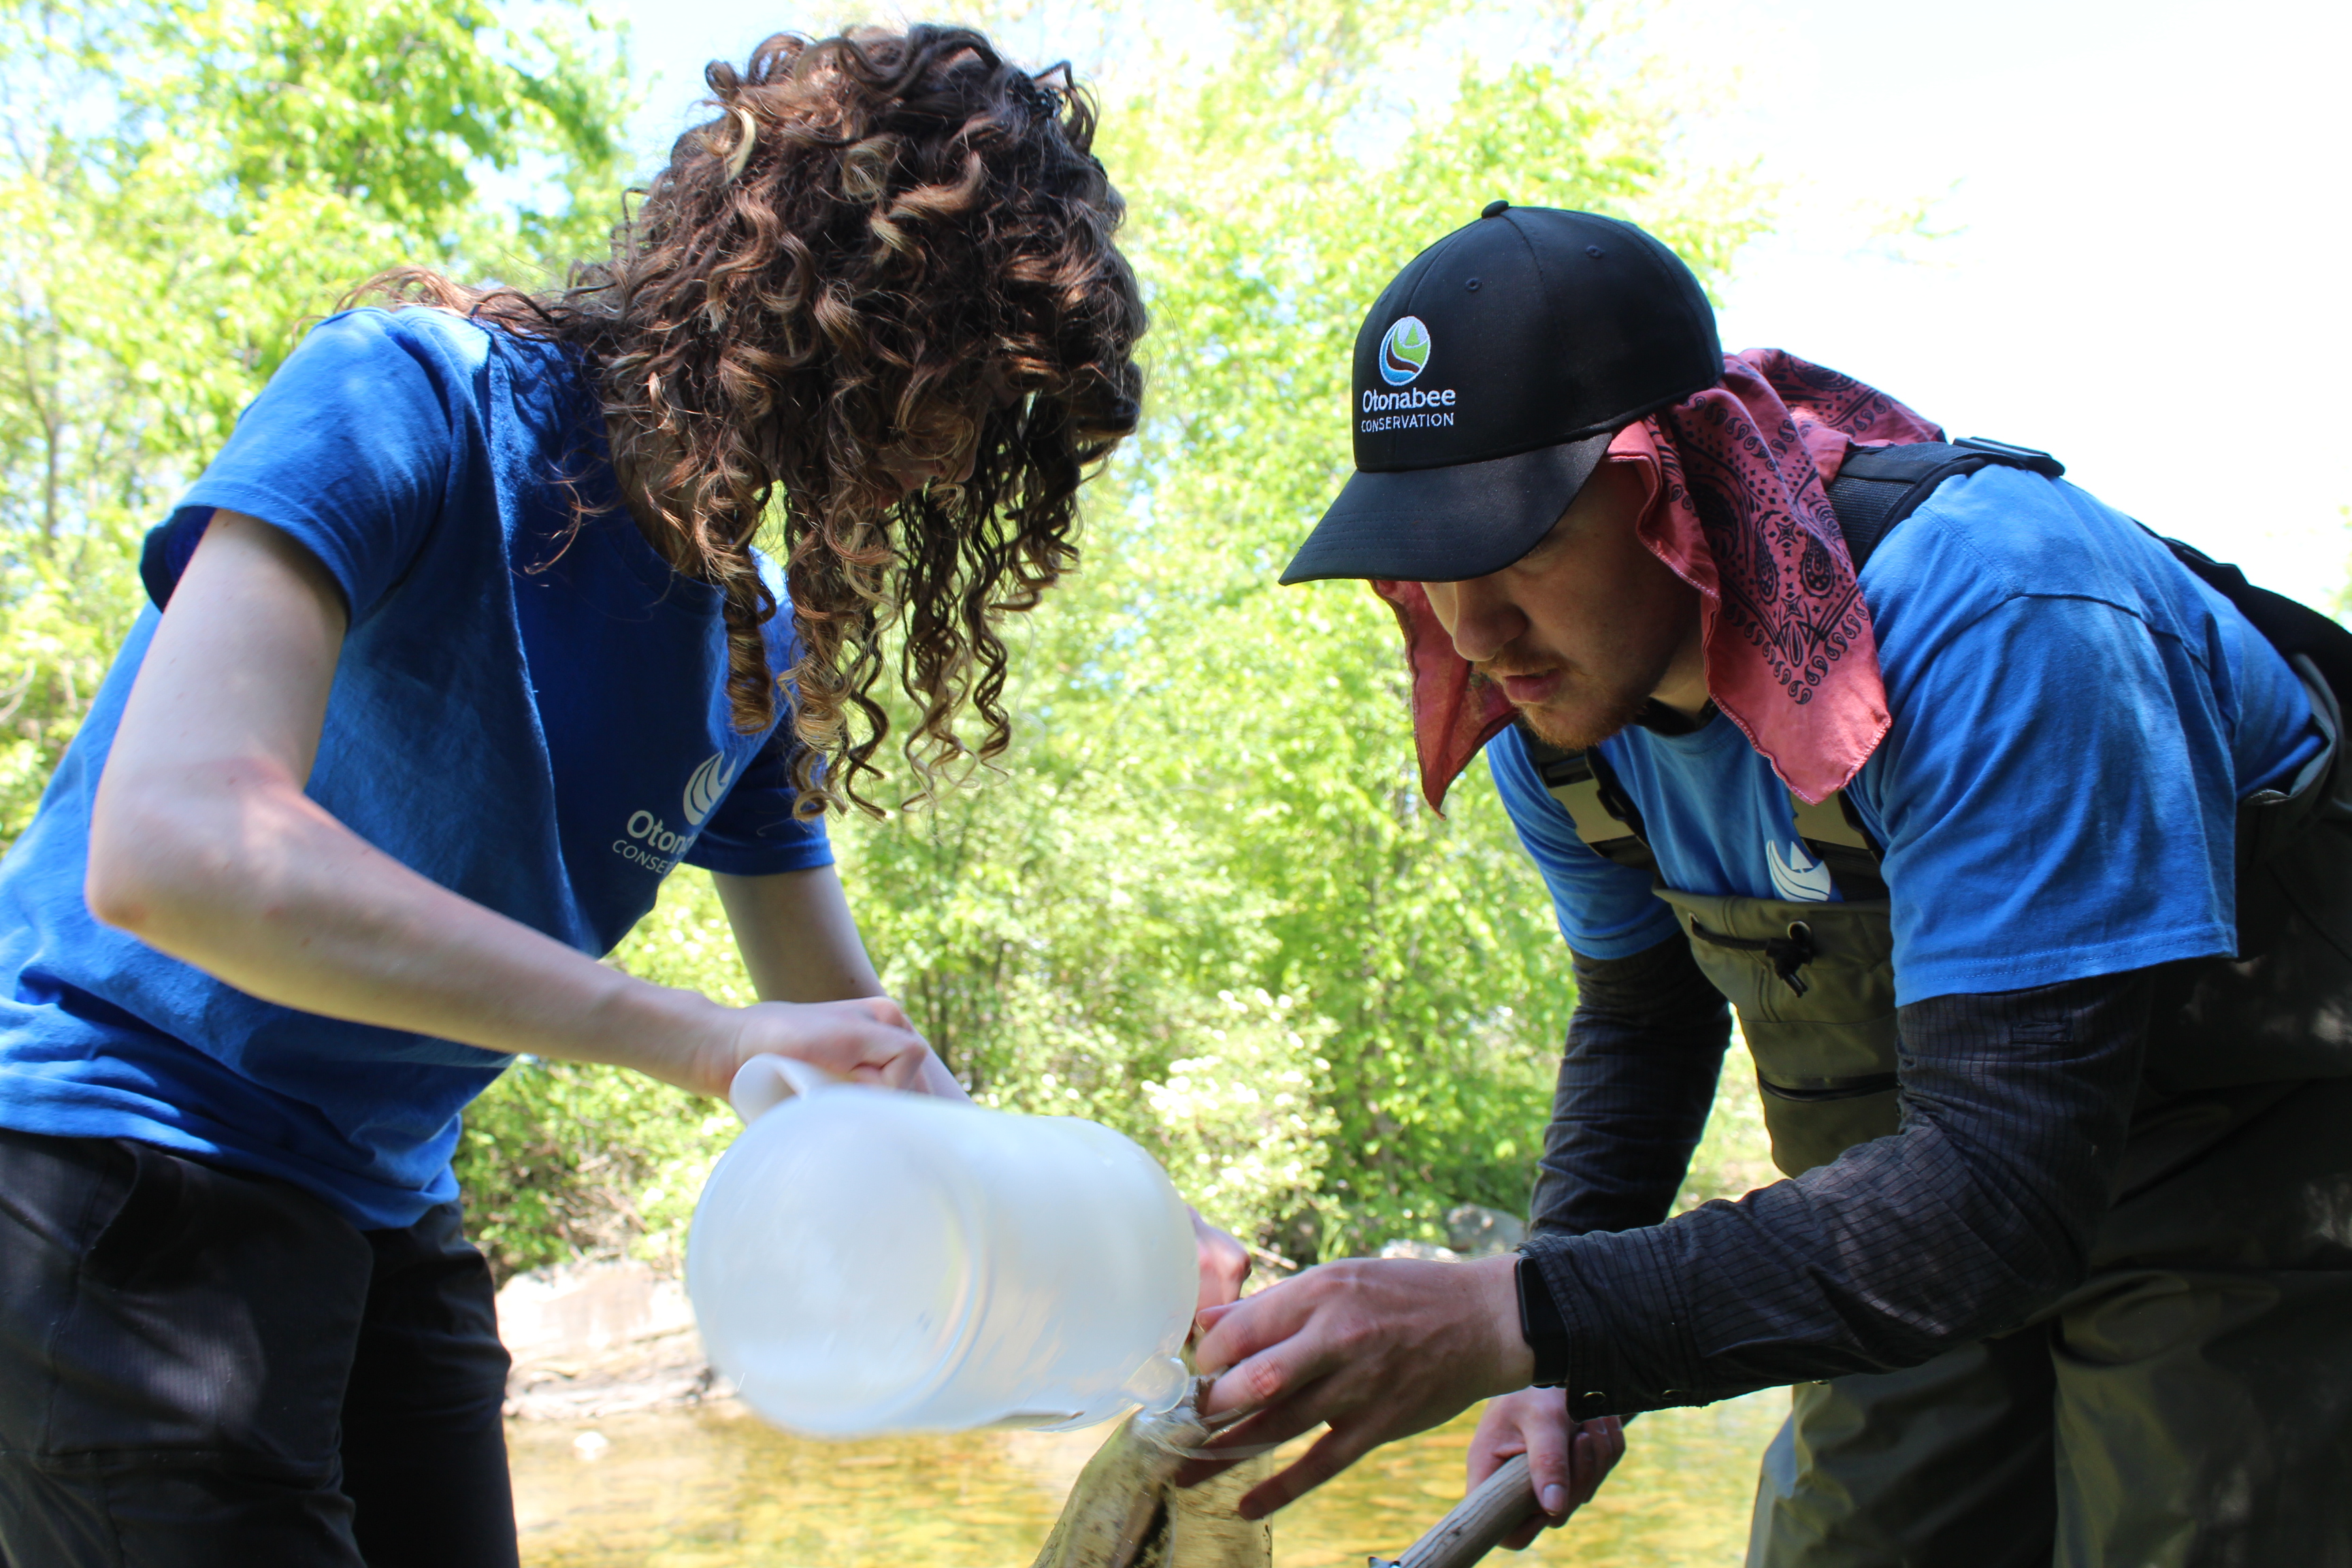
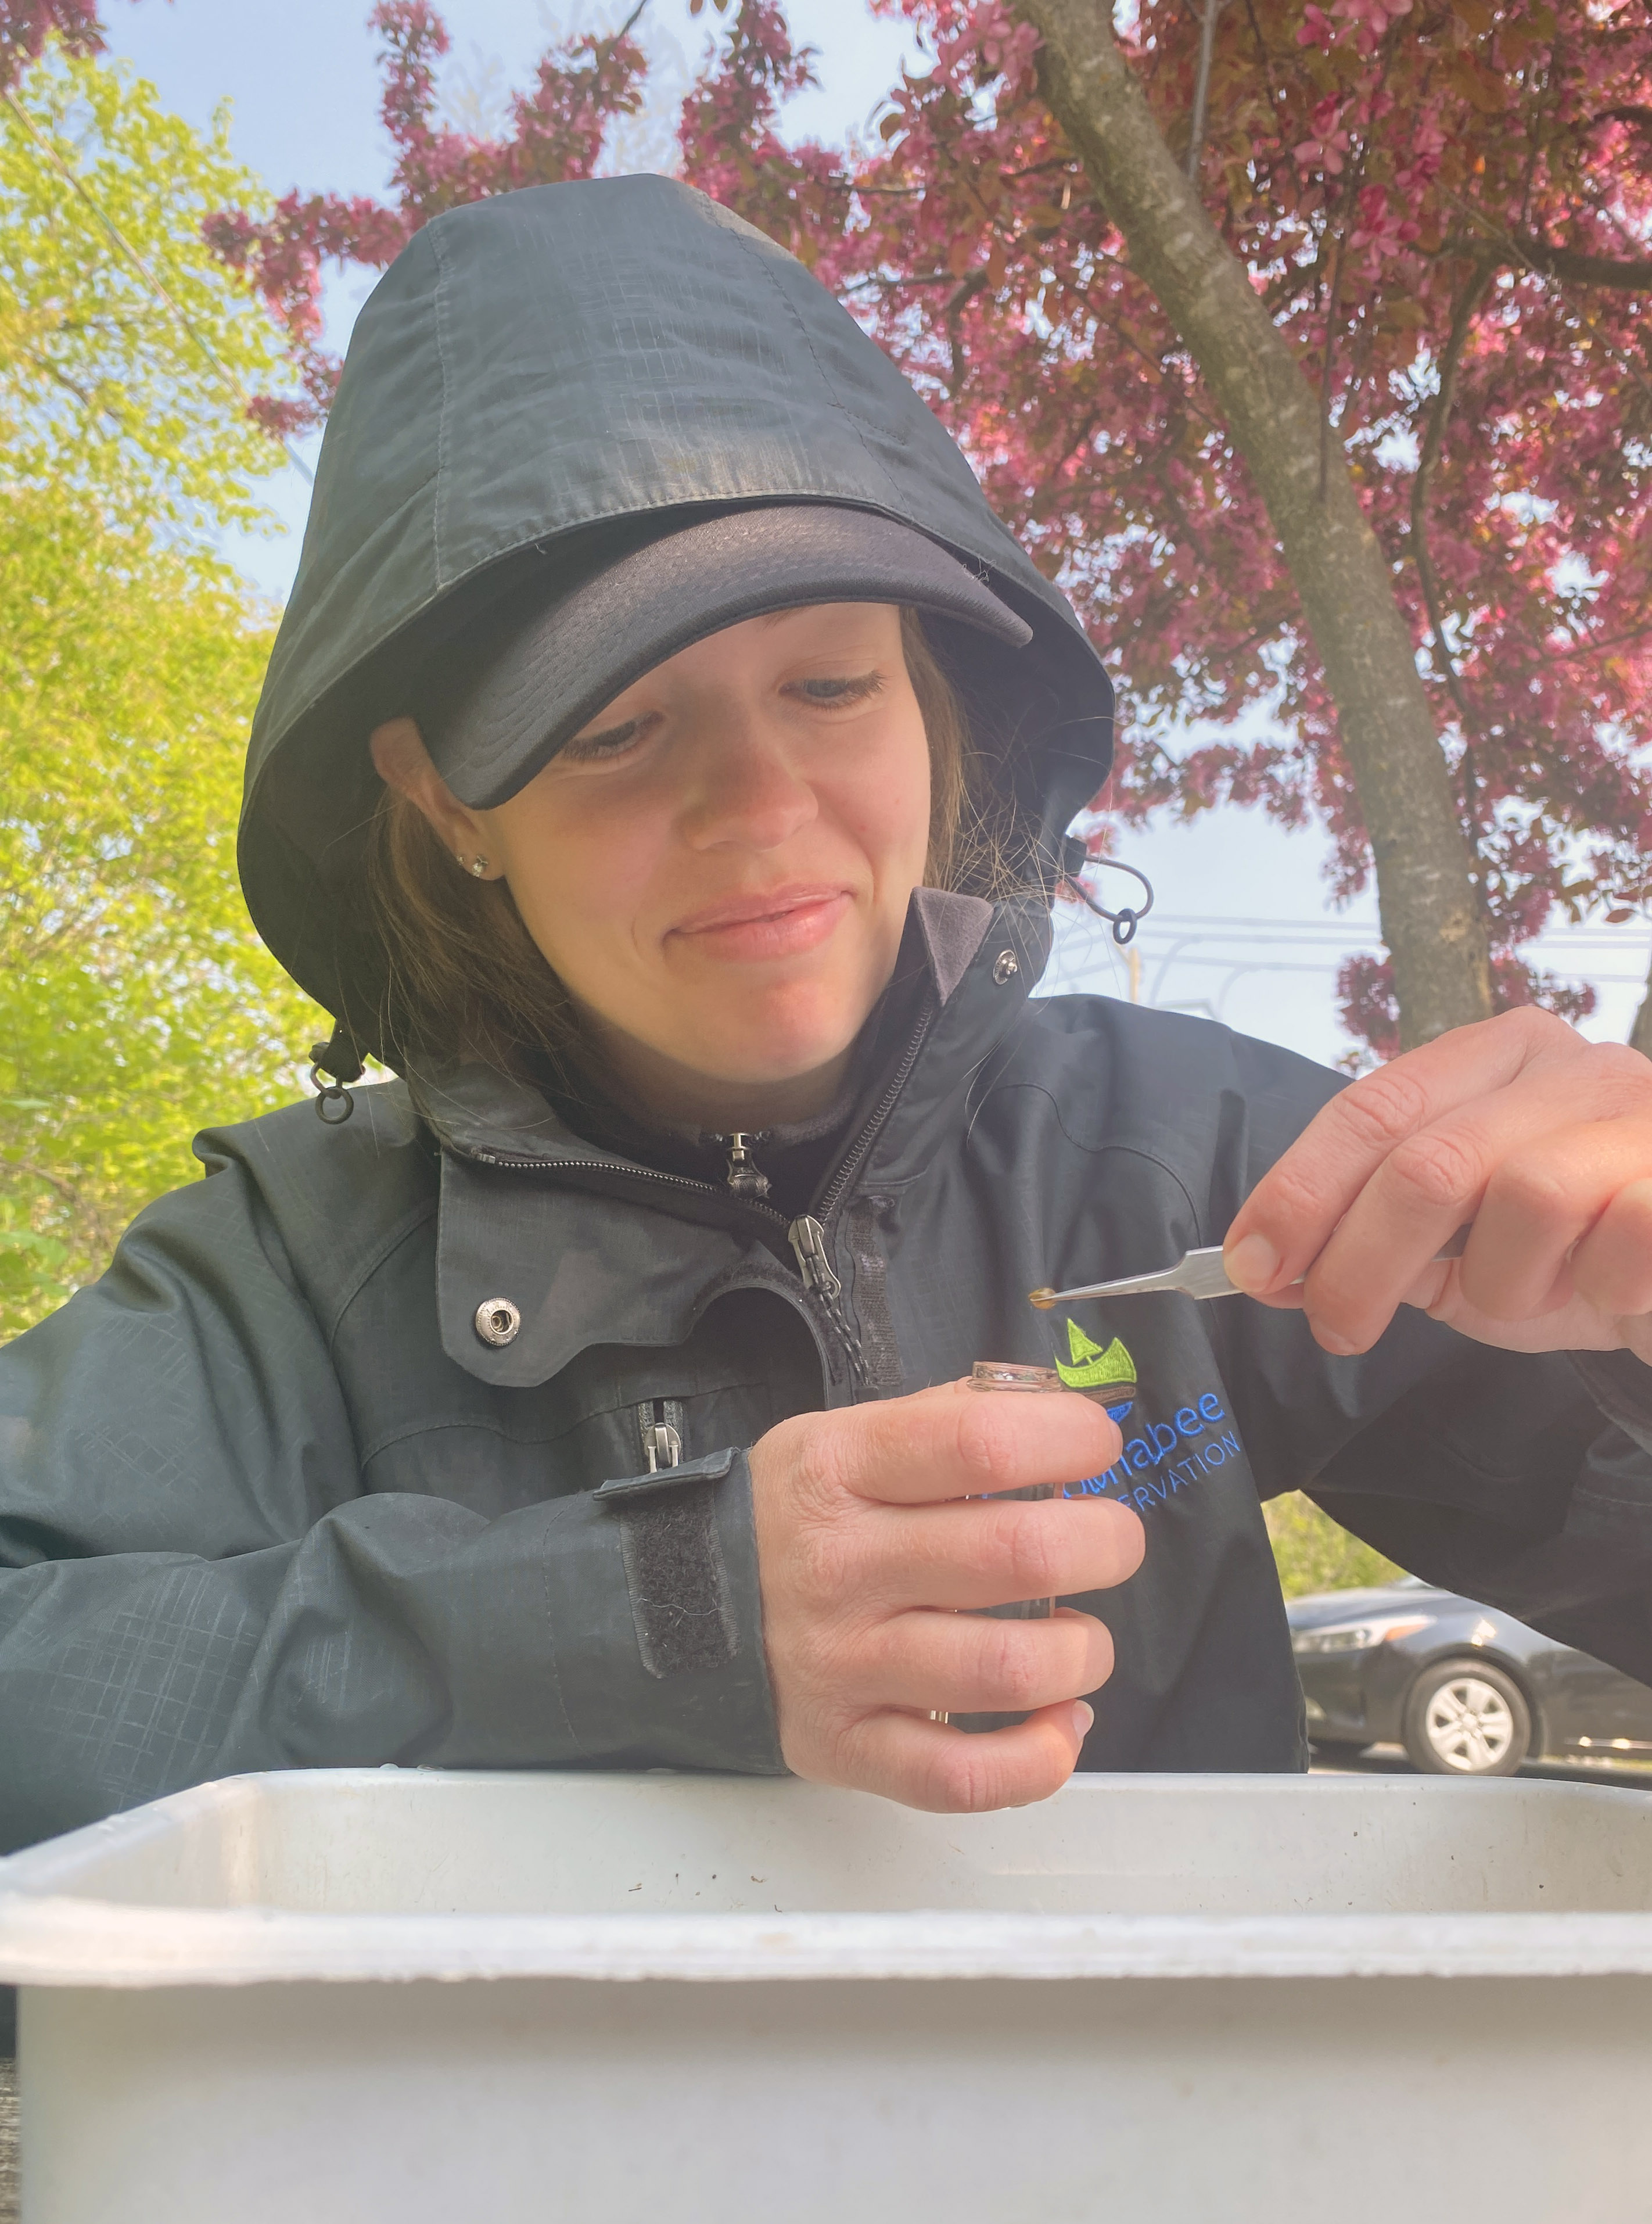
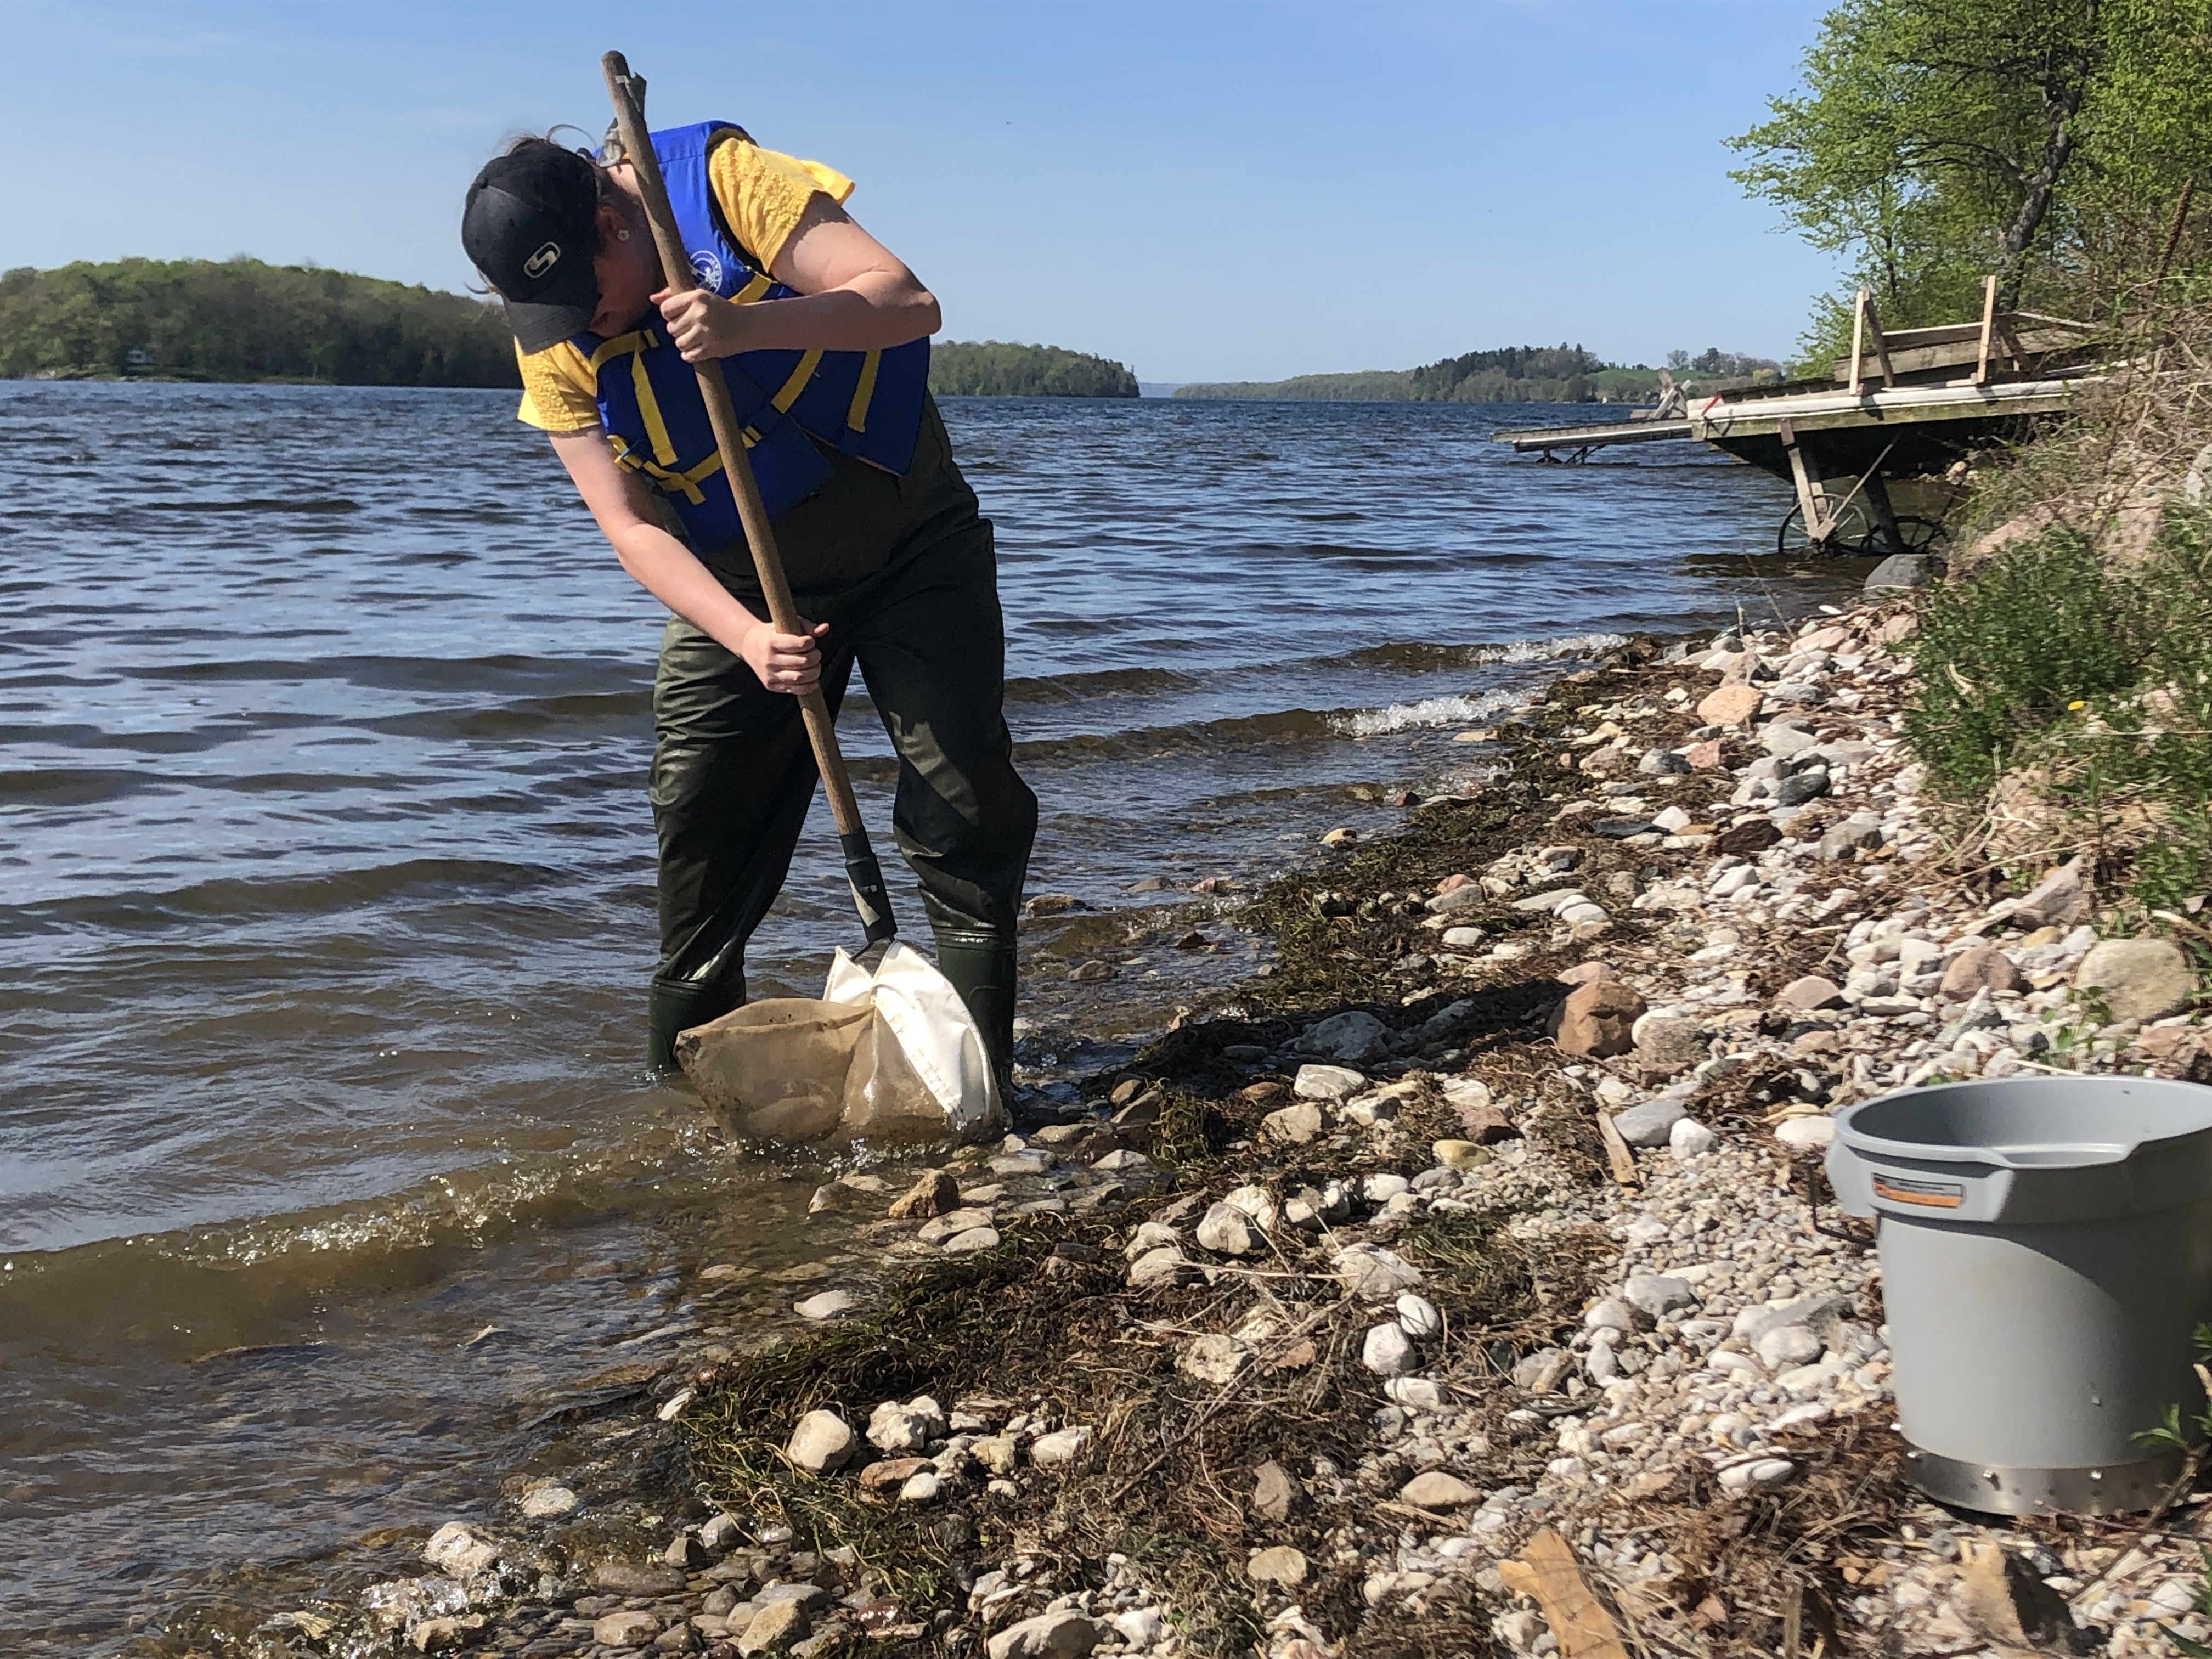
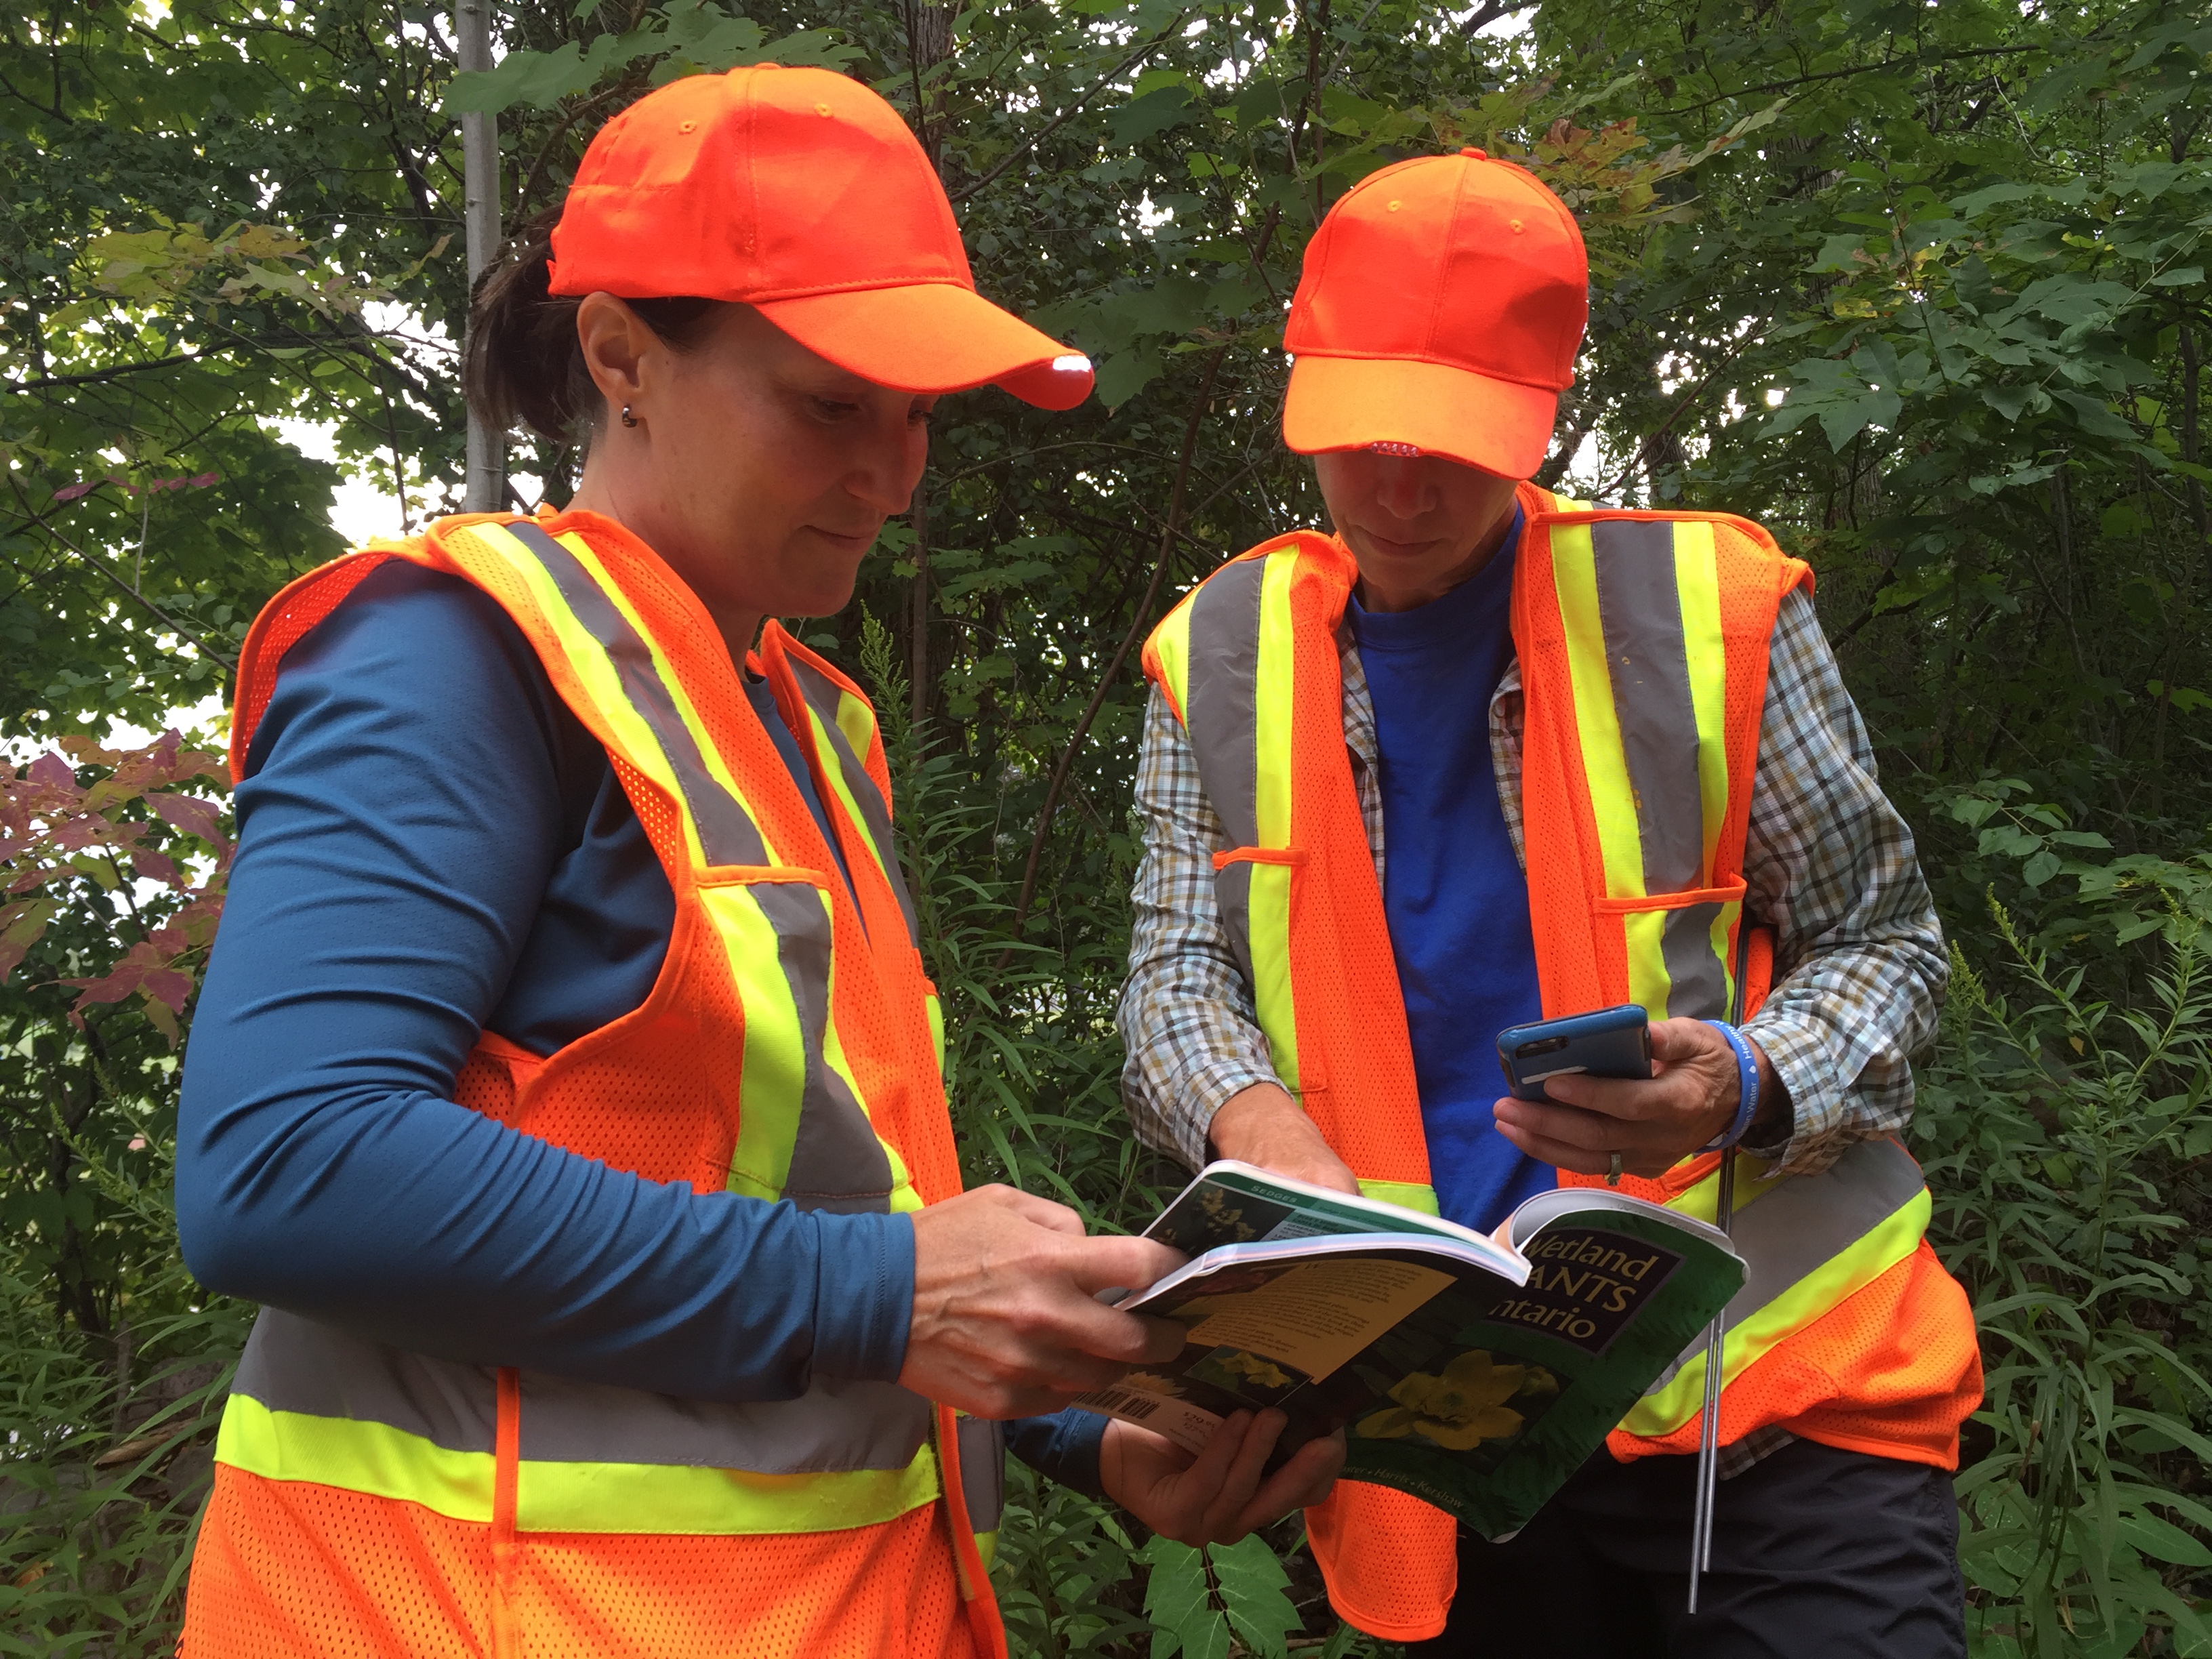
Conservation Authorities across Ontario publish Watershed Report Cards every 5 years. They include information about water quality, forests, groundwater and wetlands. Staff collect and analyze monitoring data using standardized indicators to asses watershed health. Watershed Report Cards also include information about climate change and what you can do to improve watershed health.

Otonabee Conservation's Watershed Report Cards are available for 2013, 2018, and 2023.

2023 Watershed Report Card 2018 Watershed Report Card 2013 Watershed Report Card


Learn more about the State of Ontario’s Watersheds or view Watershed Report Cards from across the Province.


Surface water is found in our lakes, rivers, creeks, streams, and wetlands. It is a key component of our environment and contributes to human health, wildlife habitat, and the economy. Otonabee Conservation has been involved in monitoring surface water quality since 1964. 

We collect samples from lakes and rivers at 20 locations throughout the watershed. These samples are collected monthly, from April until October each year. 16 locations are part of the Provincial Water Quality Monitoring Network (PWQMN). The PWQMN is a partnership with the Ministry of the Environment, Conservation and Parks (MECP). PWQMN samples analyzed for approximately 40 physical and chemical parameters.  We also collect samples at four more locations for our Watershed Report Cards.

Precipitation and water level data is collected from monitoring stations strategically located across the watershed.  This information is used in the Flood Forecasting and Low Water Response Programs delivered by Otonabee Conservation.  

Otonabee Conservation is a partner in the Provincial Groundwater Monitoring Network (PGMN). The PGMN is a partnership with the Ministry of the Environment, Conservation and Parks (MECP). Groundwater quality and quantity information is collected at 11 wells across the watershed. 

Information about groundwater quality and quantity is included in our Watershed Report Cards.

Biological indicators are living creatures that can tell us about the health of the environment. Aquatic bugs that live on the bottom of rivers, lakes, creeks, streams and wetlands are a type of biological indicator. These aquatic bugs are often the larval or juvenile stages of insects like dragonflies, stoneflies and mayflies. They are called benthic macroinvertebrates. Benthic means bottom dwelling, macro means you can see them without a microscope, and invertebrates are species without backbones.

Each species has a different tolerance to water quality conditions. This makes them great indicators of water quality and long-term aquatic health. We collect samples at 65 locations in the watershed over a five-year period. We identify the species found in each location which tells us about water quality. We can also use this information to identify changes in water quality over time. This data is shared with the Ontario Benthos Biomonitoring Network and used in our Watershed Report Cards.


Are you interested in monitoring? Become a Citizen Scientist!

There are many programs available for citizens to take part in. You can monitor water quality, climate change, wildlife, invasive species, or species at risk.

Subscribe to our News

Stay up to date on Otonabee Conservation's activities, events, programs and operations by subscribing to our News.

This website uses cookies to enhance usability and provide you with a more personal experience. By using this website, you agree to our use of cookies as explained in our Privacy Policy.